2016년 10월 19일 수요일

[Nginx] 성능 튜닝

nginx Performance

worker와 connection

  • worker_processes는 CPU 혹은 CPU Core의 총 갯수와 동일하게 맞춘다.
    • grep processor /proc/cpuinfo | wc -l CPU 갯수
    • 하지만 보통은 4개 정도가 넘어가면 이미 최대 성능치일 경우가 많다.
  • worker_connections는 하나의 worker_process가 받을 수 있는 클라이언트 갯수이다.
    • 총 접속 가능 클라이언트 갯수(MaxClients)는 worker_processes * worker_connections로 지정된다.
    • Reverse Proxy 상태에서는 worker_processes * worker_connections / 4 이 값은 ulimit -n의 결과값(open files)보다 작아야 한다. 보통 1024면 충분하다.

운영체제 설정값

  • 실무에서는 Windows에서 nginx 사용하지 말 것.
  • 운영체제 nginx 실행 계정의 ulimit -a 값이 작으면 오류가 발생한다. worker_rlimit_nofile 값을 줘서 튜닝해본다.

버퍼

  • Proxy를 사용할 경우 버퍼의 크기가 너무 작으면 nginx는 임시 파일을 만들어 proxy에서 전달되는 내용을 저장하게 된다. 장비의 메모리 상황등을 참조하여 적당한 수준으로 늘려줘야 한다.
client_body_buffer_size 8K;
client_header_buffer_size 1k;
client_max_body_size 2m; # 파일 업로드를 2mb 이상할 예정이라면 이 값을 늘려줘야 한다.
large_client_header_buffers 2 1k;

timeout

지연시간이 길 경우 브라우저의 접속을 끊어서 서버 성능을 높여 주도록 한다.
client_body_timeout   10;
client_header_timeout 10;
keepalive_timeout     15;
send_timeout          10;
  • 혹시 대용량 트래픽시에 에러가 나는 것은 한계 트래픽에 가까웠을 때 timeout으로 인한 것은 아닐까? timeout을 높이면 에러가 안나는?

access log를 꺼라

  • js,image,css 등은 일반적으로 access 로그를 남길 필요가 없다. 해당 location에 대한 access log를 꺼서 Disk IO 부담을 줄여주도록 한다.
location /images {
    access_log off;
}

혹은

location ~* \.(js|css|png|jpg|jpeg|gif|ico) {
    access_log off;
}

Keep Alive 튜닝

  • keepalive를 무작정 선택하지 말고 성능 테스트를 해가며 조정해 볼 것.

Disk IO 병목

  • open_file_cache를 해주자.
     open_file_cache max=1000 inactive=20s; 
     open_file_cache_valid    30s; 
     open_file_cache_min_uses 2;
     open_file_cache_errors   on;

tcp_nopush, tcp_nodelay

  • 보통은 할 필요 없다.
  • 하면 성능 향상이 있을 수 있지만, 때로는 오히려 저하가 발생할 수도 있다. 따라서 꼭 테스트가 필요하다.
  • sendfile on;
    tcp_nopush on;
    tcp_nodelay on;

출처 : http://kwonnam.pe.kr/wiki/nginx/performance

[Nginx] 12 steps to optimize Nginx for maxium performance

12 steps to optimize Nginx for maxium performance
We all love Nginx because it’s open-source, free and a high performance solution for any website. By default it provides a great web speed, however, you can get 100% more speed if you tweak nginx properly. In this tutorial, I’ll teach you the basics about optimizing Nginx for maximum performance.
Welcome to the Nginx Optimization Guide, and remember this nginx optimization tutorial does not cover PHP / OS performance tweaks, it just focus on Nginx entirely.
1) Hardware: choose your hardware platform carefully
That’s a crucial question when you are going to serve traffic with Nginx web server. For example, if you are going to use Nginx for static file only, you won’t need a huge amount of ram or a big CPU, however if you use php with php-fpm and mysql on the same server you probably will need a better CPU with more RAM. I’m talking in general terms here, it all depends on how much traffic you have. Have that in mind.
2) Use standalone Nginx, don’t use it as proxy for apache
Why using nginx as a proxy for apache? Today almost every application works perfectly with Nginx without the need of having apache or another web server installed as backend. It may take some time to get it working (most if you use rewrite rules), but the performance you will get will exceed any previous expectations. Give it a try!
3) Install Nginx from the source code with minimal required modules
If you compile nginx from source, you will get no extra stuff than what you really need, that doesn’t happen when you use a rpm or deb file that already includes lot of extra modules and configurations you probably won’t use.
Compiling fromn source only with required moduels reduces the memory footprint and improves the server performance.
You can choose what modules are compiled when you run “./configure” command, then you can choose –with-module and/or –without-module names. Most used are with–http_gzip_static_module –with-http_ssl_module –with-http_stub_status_module. Example:
./configure --with-http_gzip_static_module --with-http_ssl_module --with-http_stub_status_module
And remember, if you need to add a module in the future, you can recompile again adding all the modules you need.
4) Worker_process and worker_connection tunning
worker_process tunning
This is one of the most important directives. It allows you to set the maximum number of simultaneous processes that nginx can handle. To know the correct value for this, you must find how many CPUs do you have in your server, and that can be easily done running this command from the shell:
grep processor /proc/cpuinfo | wc -l
Example:
[user@server ~]$ grep processor /proc/cpuinfo | wc -l
8
Then edit nginx.conf and set:
worker_processes  8;
worker_connections tunning
This directive determines how many clients will be served by each worker process. If you have high traffic, you may need to tweak it to higher values. For most sites, 768 (default value) to 1024 is just fine.
max_clients = worker_processes * worker_connections
5) Tweaking Buffers
This is one of the most important things to tweak to avoid high write and read IO. If you set this buffer variables too low, it will have to write/read in the disk, and that is traduced in low performance and a higher load average in te box. This is just an example:
client_body_buffer_size 10K;
client_header_buffer_size 1k;
client_max_body_size 8m;
large_client_header_buffers 2 1k;
Nginx official documentation explanation:
client_body_buffer_size: If the request body size is more than the buffer size, then the entire (or partial) request body is written into a temporary file.
client_header_buffer_size: For the overwhelming majority of requests it is completely sufficient with a buffer size of 1K.
client_max_body_size: Specifies the maximum accepted body size of a client request, as indicated by the request header Content-Length.
large_client_header_buffers: assigns the maximum number and size of buffers for large headers to read from client request.
6) Set proper Timeouts
This are some example timeouts, you can tweak this as you need to improve server performance.
client_body_timeout 12;
client_header_timeout 12;
keepalive_timeout 15;
send_timeout 10;
Nginx official documentation explanation:
client_body_timeout: Directive sets the read timeout for the request body from client. The timeout is set only if a body is not get in one readstep.
client_header_timeout: Specifies how long to wait for the client to send a request header (e.g.: GET / HTTP/1.1).
keepalive_timeout: The first parameter assigns the timeout for keep-alive connections with the client. The server will close connections after this time.
send_timeout: Specifies the response timeout to the client. This timeout does not apply to the entire transfer but, rather, only between two subsequent client-read operations
7) Sendfile, tcp_nodelay and tcp_nopush
Sendfile can be activated from main nginx.conf config file. It copies data between one file descriptor and another at kernel level so it’s far more efficient than the combination of read and write, which would require transferring data to and from user space.  Read more.
tcp_nodelay and tcp_nopush
This two directives affect the performance at very deep network level and determine how the operating system handles the network buffers and decides when to flush them to the end user.
  • Tcp_nopush: this option is only available if you are using sendfile, it  causes Nginx to attempt to send its HTTP response head in one packet, instead of using partial frames. This is useful for prepending headers before calling sendfile, or for throughput optimization. Read more.
  • Tcp_nodelay: helps you to avoid buffer data-sends and it is recommended for sending frequent small bursts of data in real time. This directive allows or forbids the use of the socket option tcp_nodelay. Only included in keep-alive connections. Read more.
sendfile on;
tcp_nopush on;
tcp_nodelay on;
Note: normally, using tcp_nopush along with sendfile is very good. However, there are some cases where it can slow down things (specially from cache systems), so, run your own tests and find if it’s useful in that way.
8) Enable Gzip & Expires Header
Enabling Gzip is another thing you can’t lose, gzip gives you 50% to 75% improve in website speed reducig the amount of data transfered over the network. You can enable gzip using this configuration
gzip on;
gzip_min_length  1100;
gzip_buffers  4 32k;
gzip_types    text/plain application/x-javascript text/xml text/css;
Expires header can be set from each virtual host configuration, you can place this expires directive inside http {}, server {} or location {} blocks. For example:
location ~* .(jpg|jpeg|png|gif|ico|css|js)$ {
expires 365d;
}
That will avoid unnecessary requests to your webserver while having all static stuff cached for the amount of time you need. Note: you can also tweak this separately for each file extension. Need to know more? Check out How to enable Browser Cache Static Files on Nginx
9) Disable unnecessary logs
The access_log is a file that is determined by access_log directive, and it basically logs all requests to your websites into that single file. That means you will have writing IO if you have it enabled. So, if you don’t need the access_log for data analytic, then the best you can do is disable this directive:
access_log off;
You may also modify error_log directive to only log critical logs and avoid unnecessary warning errors:
error_log logs/error.log crit;
10) Configure open_file cache
A big part of a living operating system results in opening and closing files, and that can determine a lot in your server performance. That’s why open_file_cache exists. Enabling open_file_cache allows you to cache open file descriptors, frequently accessed files, file information with their size and modification time, among other things. This can help you to significantly improve your I/O. Read more.
Tweak as you need:
open_file_cache max=5000 inactive=20s;
open_file_cache_valid 30s;
open_file_cache_min_uses 2;
open_file_cache_errors on;
11) Install Google’s PageSpeed module
PageSpeed for Nginx is a module that allows your websites to get automatically optimized in a very large number of ways (check out this link to see the complete list of features). Even it’s in beta state now, you can still try it to get the best performance for your web apps. Check out this installation guide: How to install Nginx PageSpeed module
12) Setup a Nginx load balancing solution
If you have a big traffic and you need to have high availability and also increase your web server performance, remember you can always use the fantastic Nginx load balancing feature, check out this article to know how to do it: How to configure Nginx load balancing
After you are done tweaking just restart nginx to apply the changes:
service nginx restart

2016년 10월 14일 금요일

[Tomcat] 버전 노출 방지


1. curl 방어

<Connector port="8080" protocol="HTTP/1.1"
connectionTimeout="20000"
redirectPort="8443" useBodyEncodingForURI="true"
URIEncoding="UTF-8"
server="apache" />

<Connector port="8009" protocol="AJP/1.3" redirectPort="8443" server="apache" />

server.xml 파일 내 <Connector 부분에 server="XXXX" 옵션 추가


2. Web 방어

{TOMCAT_HOME}/lib/org/apache/catalina/util

ServerInfo.properties 파일 내 아래 부분 내용 삭제 및 변경
Server.info=Apache Tomcat/톰캣 버젼
server.number=톰캣 버젼
server.built=빌드 날짜

위 파일이 해당 위치에 없을 경우에는 {TOMCAT_HOME}/lib/catalina.jar  안에 포함되어 있음.

properties 내용 수정후 톰캣을 재실행


2016년 10월 11일 화요일

[Varnish] 모니터링

Varnish is a web application accelerator. It is a reverse proxy that acts like a HTTP cache. Since it allows speeding up the service through content caching, it’s a very useful app for web apps or services with a high traffic volume. The typical app architecture used by HTTP cache is like the one below.
esquema_varnish-01-01
All the HTTP traffic goes through the Vanish server. Before requesting information to the backend server, it uses Varnish cache to obtain information.
As the cache server processes all the requests, Varnish cache becomes a crucial piece everywhere it runs. That is why it is essential to be sure that Varnish cache is working fully as expected. Otherwise, it could become a bottleneck that would slow down the entire app. The best way to watch closely the proper performance of Varnish is by monitoring the key performance variables of this server.
Varnish Cache Performance parameters 
Once installed, Varnish Cache allows us to use several apps to evaluate the server by means of statistics. These apps are the ones mentioned below.
  • varnishtop: grouped list with the most usual entries from different logs.
  • varnishhist: a histogram that shows the time taken for the requests processing.
  • varnishsizes: it performs the same task as “varnishhist” but showing the size of the objects.
  • varnishstat: it shows many contents on cache hits, resource consumption, etc..
  • varnishlog: it allows us to see all the requests made to the web backend server.
If you need further information on these commands or additional ones, check the Varnish cache documentation out! (https://www.varnish-cache.org/docs/3.0/index.html).
Vanishstat is the command that gives us the most useful information to check the performance.  The rest of commands provide detailed information about requests and logs. These commands are very useful when you need to configure and debug the cache server operation (performance).

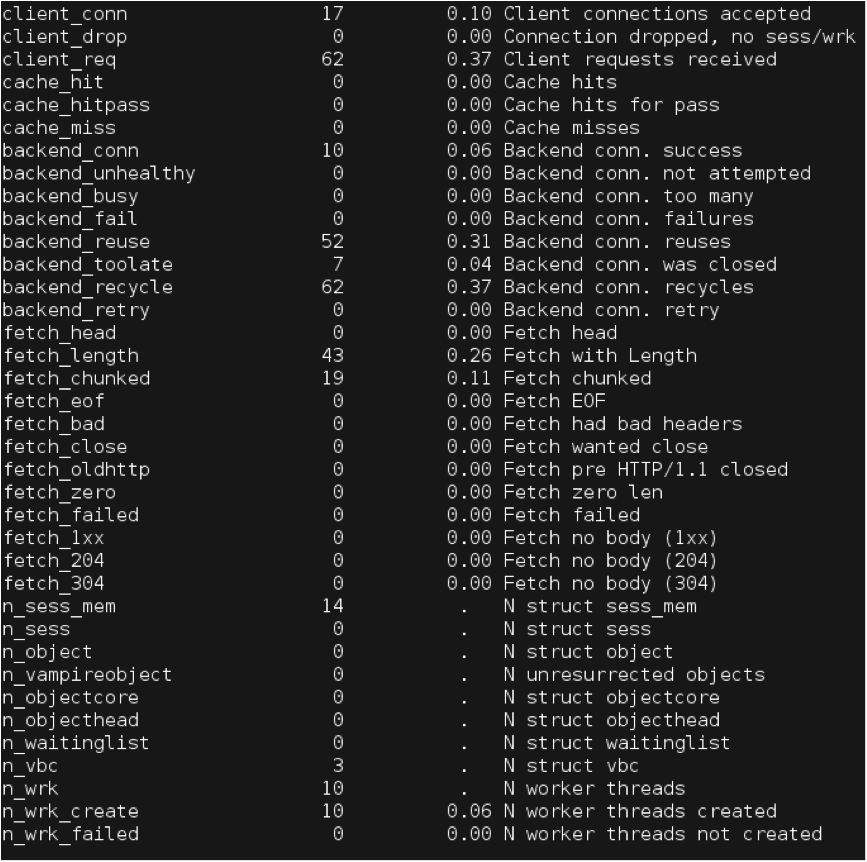
Once the “varnishstat -1″command has been executed in the same server as varnish cache, we will get a log list of metrics.
blackscreen                                               The basic metrics to check the performance level are the following ones.
  • client_conn : accepted client connections
  • client_req : received client requests
  • backend_fail : backend connection failure
  • cache_miss : cache misses
  • n_object : number of instantiated objects
  • n_wrk : number of worker threads
  • n_wrk_create : number of created worker threads
  • n_wrk_failed : number of failures when creating worker threads
  • n_wrk_max : maximum number of worker threads
  • n_wrk_drop : number of abandoned work requests
  • n_lru_nuked : number LRU objects
  • esi_errors : ESI parsing errors
  • n_expired: number of expired objects
With this command, you can get a snapshot of the performance statistics. A single snapshot is not enough to check the trend. To accomplish this task, you need older data, for example, data from the previous week or the previous month in order to compare different configurations over time.
To get this information, the most important variables over a period of time must be monitored. With this information, you can easily see if the changes made in the varnish configuration improves the performance. We will use Pandora FMS and the varnish cache plugging that is available in the library to monitor Varnish cache. Pandora allows us to set alerts that will notify us on performance problems and will send us reports with the evolution of different metrics. With these features, we can be sure that we will be reported on any problem in our server.
How to monitor Varnish with Pandora FMS
The first thing to do is downloading and installing Pandora FMS. You can find an OS image or a preconfigured virtual machine for VMware here:  http://pandorafms.com/Community/download/en
Once Pandora FMS has been installed, it’s necessary to install a Pandora FMS agent in the machine where the Varnish cache server is running. Click on the following link to find agents for different:  http://sourceforge.net/projects/pandora/files/Pandora%20FMS%204.0.3/
To learn how to install every component step by step, click on the following link and check the official Pandora FMS documentation out: http://www.openideas.info/wiki/index.php?title=Pandora:Documentation_en
Now, it’s Varnish pluging’s turn. Click on the link below to install the pluglin  http://pandorafms.com/index.php? sec=Library&sec2=repository&lng=en&action=view_PUI&id_PUI=537
3
You just have to unzip the zip file to install the plugin and copy the files “varnish-plugin.pl” and “varnish-plugin.conf” into the agent installed plugins folder in the Varnish server. You can use the following commands:
# unzip varnish-plugin.zip
# cp varnish-plugin.* /etc/pandora/plugins
Once the plugin is in the right location, we can configure it. To accomplish this task, you have to edit the configuration file. The default file is called “varnish-plugin.conf” and has the following structure:
METRIC
hit_ratio
connect_accept_ratio
backend_success_ratio
work_thread_ratio
STATS
client_conn
client_req
backend_fail
cache_miss
n_object
n_wrk
n_wrk_create
n_wrk_failed
n_wrk_max
n_wrk_drop
n_lru_nuked
esi_errors
n_expired
This file allows you to configure two kinds of metrics: statistics and ratios. Statistics are defined by the token STATS. This category can pick any value that appears when you run the command “varnishstats -1”. Different parameters can be selected by the name that appears in the first column of the output returned by the command. Ratios are defined by the token ratios METRIC. The ratios help understanding of the Varnish performance values by providing normalized information as percentages. The available ratios are:
  • hit_ratio: cache hit ratio.
  • connect_accept_ratio: accepted connections / received requests ratio.
  • backend_success_ratio: successful backend server connections ratio.
  • work_thread_ratio: working thread / created threads ratio.
If you wish to add or remove some variables or metrics to monitor, you can make changes in the configuration file, so that the monitoring will suit your company better.
For the agent to run Pandora FMS plugin periodically, a new module must be added to the plugin configuration file. First at all, you need edit the agent configuration file (by default in “/ etc / pandora / pandora_agent.conf”) by adding the following line:
module_plugin /etc/pandora/plugins/varnish-plugin.pl /etc/pandora/plugins/varnish-plugin.conf
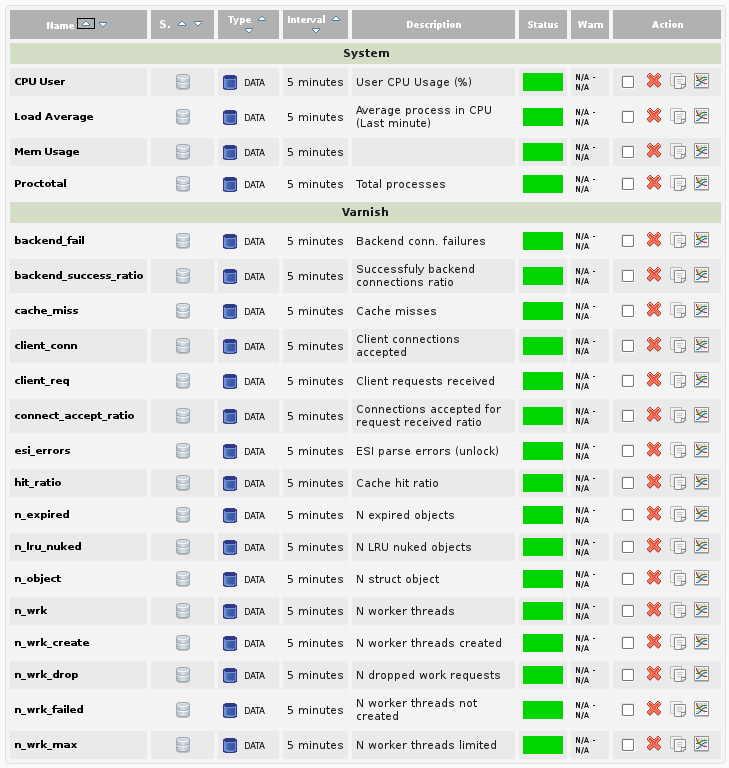
Once the agent sends data to the Pandora server, the modules and their values will appear.

For this example, as well as monitoring the variables related to the cache Varnish proxy (backend_fail, backend_success_ratio, cache_miss, etc), we would like to add some other variables related to the machine performance (User CPU, load average, Mem Usage and Proctotal). With this configuration, we will get an overview of the performance and the resources consumed by the cache server.
4
After finishing this process, we can be sure that Pandora FMS is currently collecting data from which will generate reports to evaluate the ongoing performance.
As we also wish to use the alert Pandora FMS features, we need to perform some additional configuration modules. The next step is to set all the values ​​that define the state of the module. These values ​​will use normalized values between 0 and 100 according to the modules that represent ratios. They will provide enough information to evaluate, in a first instance, the performance of Varnish. The threshold settings would be like this:
Modulo
Min Warn
Max Warn
Min Crit
Max Crit
backend_success_ratio
51
70
0
50
connect_accept_ratio
0
5
20
100
hit_ratio
51
70
0
50
work_thread_ratio
51
70
0
50
Mem Usage
80
90
91
100
CPU User
85
90
91
100
 With this configuration, for example, the hit_ratio module will turn automatically into a critical status when the number of cache hits is between 0% and 50%. It will change into a Warning status when the number of cache hits is between 51% and 70%. Besides, we have also defined thresholds to set alerts on system modules, specifically on the use of CPU and memory. Now that the modules show clearly their status, we can create Pandora alerts to warn us when detecting any problems.
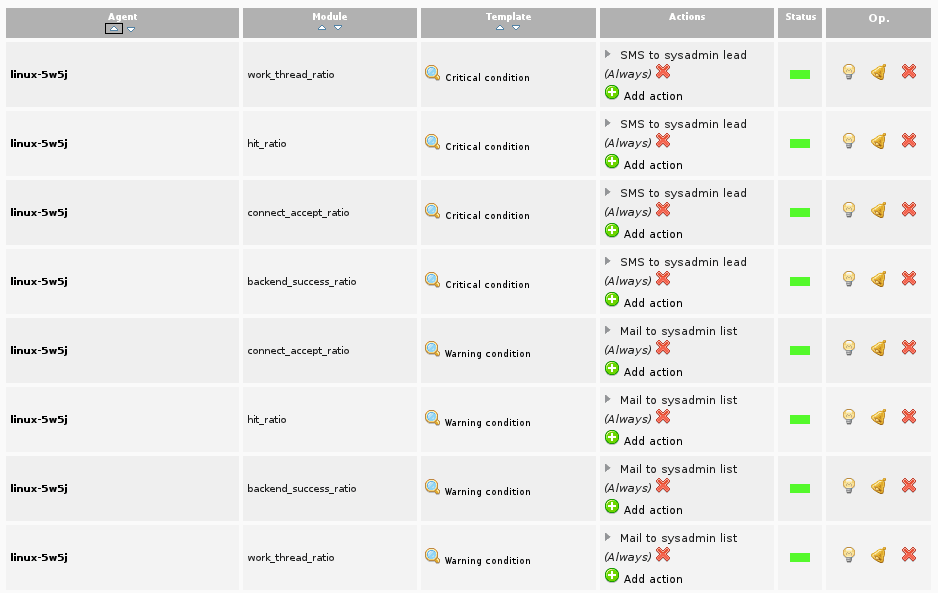
We have defined different reporting methods depending on how critical the status is. Thus, Pandora will send an email to the list of system administrators when the status is not that critical. However, when the status is very critical, a SMS will be sent to the leaders and managers of the IT architecture of the website.
At this point, we have already configured a reactive monitoring in our Varnish cache server. It means that we will be notified on problems so we can react fast to find a solution.  However, although this process is accomplished, we should fix trends and act accordingly to have a proactive monitoring.
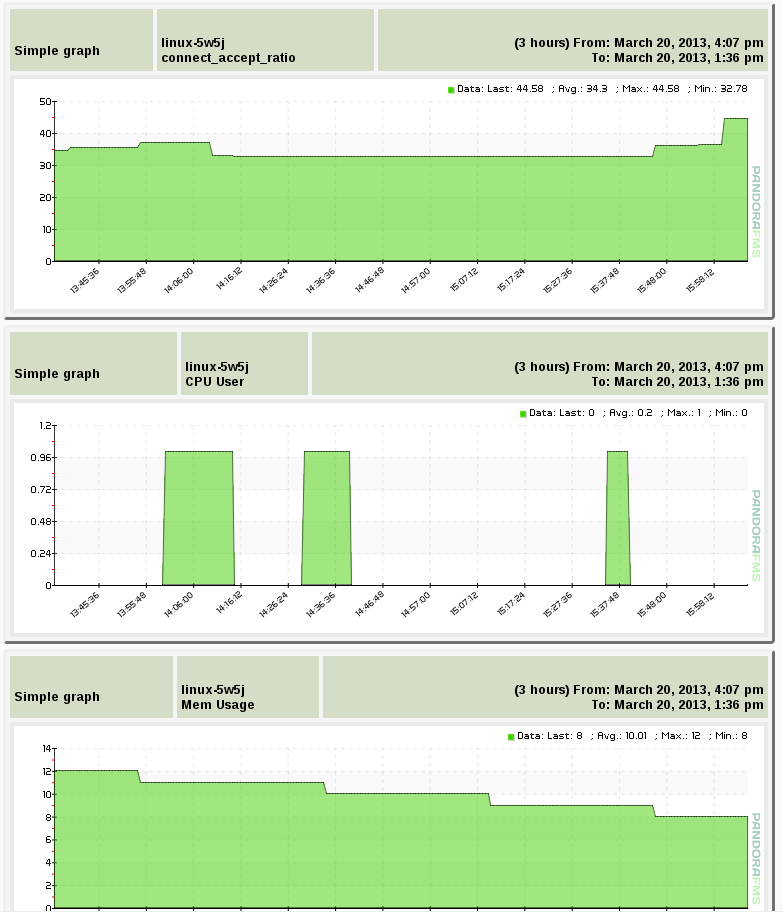
Pandora also allows you to create reports to see the grouped information about the trends easily. In this case, we have created a report on Varnish performance with the system performance parameters.
5
jk

Besides, Pandora FMS allows you to configure the sending procedure. You can decide when to receive the emails with the reports: every week, every month, every fortnight, etc. So that we can have a complete study of trends Varnish automatically in our email, without having to go to the Pandora FMS.
po            
Conclusion
With this configuration, you will be notified on any failures on the Varnish Cache server. Thanks to the alert features, you will be notified on any problems that may arise in your web application cache. Furthermore, by means of the reports, you can see trends and perform a preventative maintenance on the server to prevent future failures. Since Varnish is the only entry point for all web traffic, this way of monitoring will allow you to be protected from bottlenecks that slow down your systems.